Error sensitivity evaluation
Test purpose
Quantify how sensitive the device is to beam delivery errors.
Test method
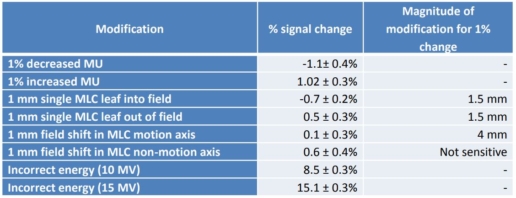
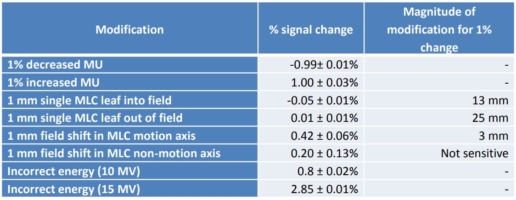
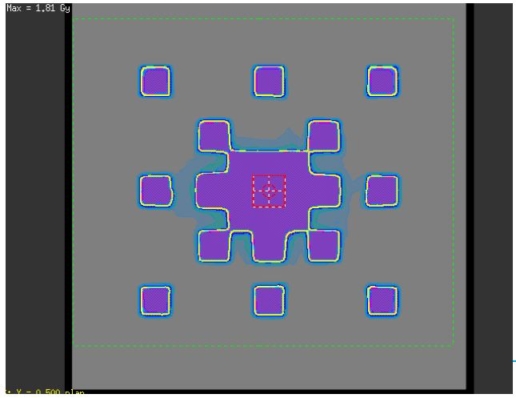
Various errors were introduced into a 10 cm x 10 cm beam as well as in a 1 cm x 1 cm beam. These errors included 1% change in MUs, 1 mm single leaf motion, 1 mm field size shift and energy changes.
Test results
Modifications to the photon beams resulted in changed IQM signal. The simulated errors were detected in 6 MV 10 cm × 10 cm photon beam. Twice the SD of the stability (1%) of the measurement was considered a “detected” error. For small fields (SBRT) the non-finite detector resolution changes the detectable errors. Simulated errors were detected in 6 MV 1 cm × 1 cm photon beam.
Conclusion
The IQM System demonstrates sufficient stability for online delivery quality assurance measurements and sufficient sensitivity for all simulated beam delivery errors.
This test report is based on a publication created by UC Davis, Sacramento (USA).
Please click on the „More information“ link to access the publication website.
Characterization of the IQM System
Test purpose
Evaluate the stability and accuracy of each feature of the IQM.
Test method
The short-term and long-term signal reproducibility was evaluated. The signal linearity and dose rate dependency was tested. The inclinometer, barometer and thermometer measurements were compared against calibrated devices.
Test results
Simple photon beam measurements showed a short-term signal reproducibility with a standard deviation of 0.14% and a long-term (over 4 weeks) signal reproducibility with a standard deviation of 0.47%.
The linearity between the MU delivered and the changes in IQM signal is proportional: R2 = 1.
The dose rate dependency is minimal.
The IQM thermometer agreed to the calibrated thermometer to within 1.0
± 0.7°C.
The IQM barometer agreed to the mercury barometer to within 2.3 ± 0.4
mmHg.
The IQM inclinometer agreed with the spirit level for gantry: 0 and 180 degrees within 0.03 ± 0.01 degrees and for 90 and 270 degrees within 0.27 ± 0.03 degrees
For the collimator angle measurement, the IQM inclinometer agreed
with the plum-bob within 0.3 ± 0.2 degrees with the gantry at 90
degrees.
Conclusion
The IQM demonstrated:
- Valid temperature and pressure correction
- Useful gantry and collimator angle readings
- Valid and reproducible photon beam measurements
This test report is based on a publication created by UC Davis, Sacramento (USA).
Please click on the „More information“ link to access the publication website.
Error detection capability
Test purpose
Evaluate the error detection capability of the IQM System.
Test method
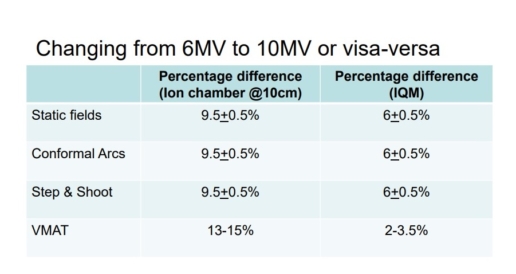
The influence of a variety of errors on the IQM signal was evaluated. The introduced errors included incorrect positioning of the beam, incorrect calibration of the MLC, wrong treatment beam energy and application of wrong treatment plan.
Test results
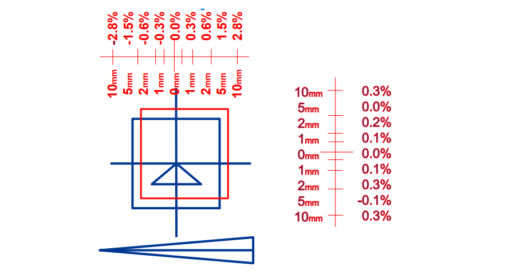
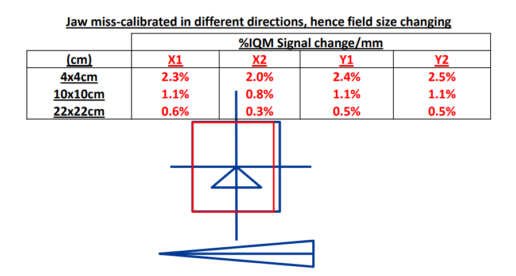
The IQM signal changed significantly for every introduced error. Moving the treatment beam changed the IQM signal between 0.3% and 2.8%. Moving a jaw changed the IQM signal up to 2.5%. Changing the energy on different treatment technique changed the IQM signal up to 9.5%. Delivering the incorrect plan (even when Patient Name and ID are the same) is detected before the 5th control point.
Conclusion
The IQM is stable, reliable & easy to use. IQM can identify:
- Incorrect MUs & Energy
- Shifts in the gradient direction
- Significant MLC miscalibration
- Incorrect plans
This test report is based on a publication created by The Christie, Manchester (UK).
Please click on the „Download“ button to download the complete publication.
Signal stability
Test results
The signal was reproducible with a standard deviation of 0.6% during the test period.
Conclusion
IQM does an excellent job in real-time monitoring of beam delivery
This test report is based on a publication created by Radboud UMC, Nijmegen (The Netherlands).
Please click on the „Download“ button to download the complete publication.
Error detection sensitivity
Test purpose
Evaluate the error sensitivity of the IQM system.
Test method
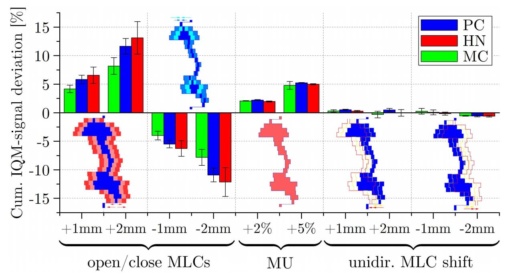
15 VMAT plans (5 prostate, 5 breast and 5 Head & Neck) were evaluated. A variety of clinically relevant errors were introduced into a VMAT plan. Single segments were modified with single leaf bank errors of +1mm, dual leaf bank errors of 1mm and 2mm, uni-directional shifts of 1mm and 2mm as well as a MU increase of 2% and 5% in a single segment.
Conclusion
IQM shows very good dosimetric properties and error detection sensitivity. IQM can potentially replace the 2D plan verification method.
This test report is based on a publication created by Lake Constance Radiation Oncology Center, Singen/Friedrichshafen (Germany).
Please click on the „Download“ button to download the complete publication.
Long-term signal stability
Test purpose
Evaluate the long-term signal stability of the IQM system.
Test method
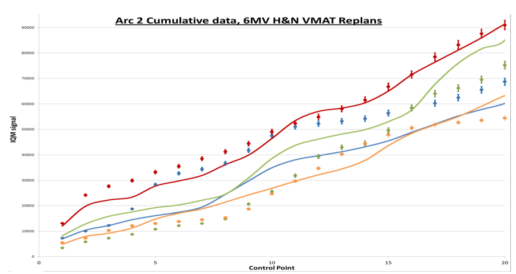
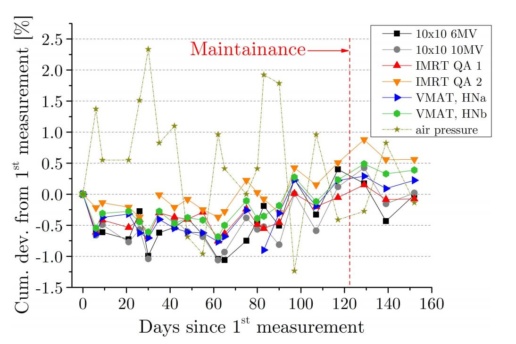
Each one 10cm x 10cm field for 6MV and 10MV, two IMRT QA plans as well as two VMAT Head&Neck plans were delivered on 160 days between October 2016 and February 2017.
Conclusion
IQM shows a good stability of the cumulative signal sufficient for clinical use.
This test report is based on a publication created by Lake Constance Radiation Oncology Center, Singen/Friedrichshafen (Germany).
Please click on the „Download“ button to download the complete publication.
Error detection capability
Test purpose
Evaluate the error detection capability of the IQM system.
Test method
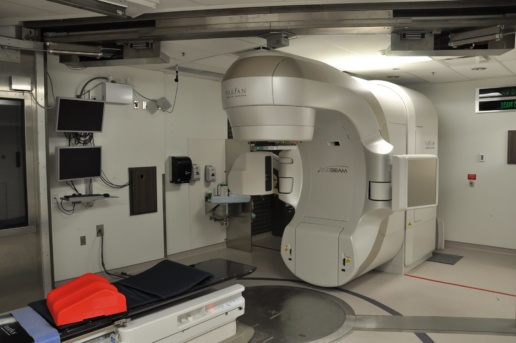
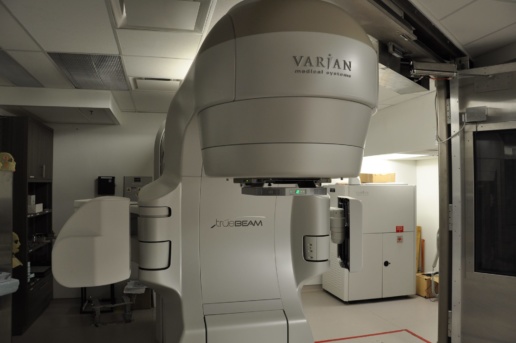
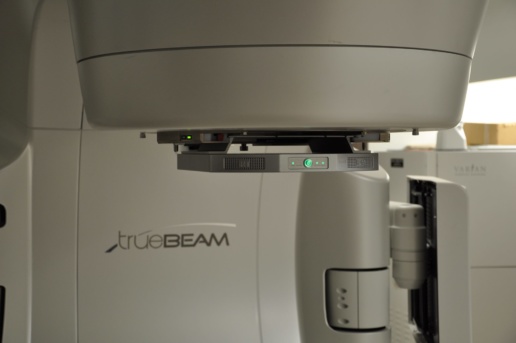
32 Head & Neck VMAT test fields (with 110 segments each) were calculated using the IQM CALC application, then delivered by a TrueBeam LINAC for 15 fractions over a course of 50 days.
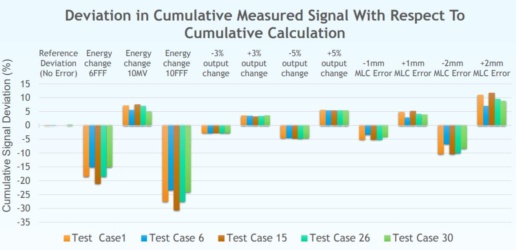
The error detection capability of the IQM system was tested by introducing the following systematic errors into 5 randomly chosen test plans: ±3% and ±5 % change in total MU (simulating machine output change); ±1 mm and ±2 mm change in MLC bank position (simulating calibration error); and energy mix-up from 6MV to 6FFF, 10MV, and 10FFF. The differences in measured and calculated cumulative signals were then quantified.
Conclusion
IQM is capable of detecting 1mm error in MLC bank position, change in machine output by >3%, and any mix-up of beam energy.
This test report is based on a publication created by Princess Margaret Cancer Centre, Toronto (Canada).
Please click on the „Download“ button to download the complete publication.
Signal calculation accuracy and measurement reproducibility
Test purpose
Evaluation of the IQM signal calculation accuracy (segment-wise and cumulative) and the measurement reproducibility by utilizing a tolerance band defined for this test.
Test method
32 Head & Neck VMAT test fields (with 110 segments each) were calculated by the IQM CALC application, then delivered by a TrueBeam LINAC for 15 fractions over a course of 50 days.
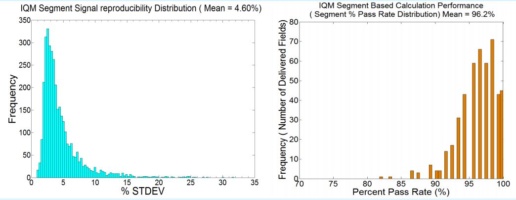
IQM segment based calculation accuracy was assessed by evaluating the
% pass rate for all delivered fields. The cumulative calculation accuracy was
measured by directly evaluating the deviation in measured cumulative signal from calculation.
IQM segment based signal reproducibility was evaluated by calculating the %STDEV for all measured signals across 15 fractions. The cumulative signal reproducibility was assessed by calculating overall deviation in measured cumulative signals from calculated signal.
Test results
A total of 52800 segments were delivered and measured.
The IQM segment-wise measured signal variation is mainly a function of signal size and accelerometer accuracy. The mean %STDEV was calculated to be 4.60%. The cumulative measured signal was reproducible to within ± 1% throughout the measurement period.
Conclusion
IQM dynamic signal reproducibility per segment was within 5% of the mean value.
This test report is based on a publication created by Princess Margaret Cancer Centre, Toronto (Canada).
Please click on the „Download“ button to download the complete publication.
Definition of a segment-wise tolerance band
Test purpose
Evaluation of the IQM beam monitoring performance for the accuracy and reproducibility of LINAC beam delivery, and those of beam monitoring performance by the IQM system to define a segment wise tolerance band.
Test method
32 Head & Neck VMAT test fields (with 110 segments each) were calculated by the IQM CALC application, then delivered by a TrueBeam LINAC for 15 fractions over a course of 50 days.
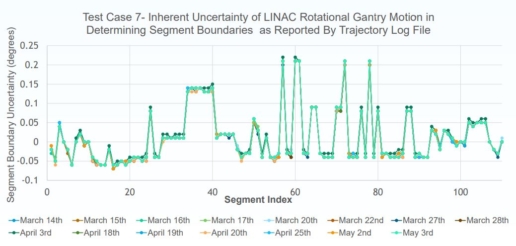
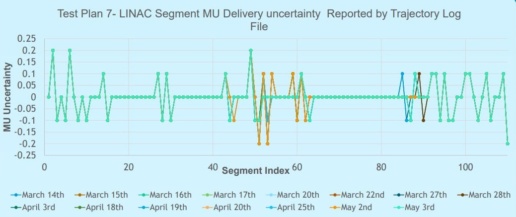
Assessment of LINAC’s beam delivery reproducibility, and accuracy of the delivered MU, and start/ end segment gantry angle for each segment was done by direct comparison of Trajectory Log Files (TLF) with corresponding planned parameters.
Similarly, gantry angles determined by the IQM accelerometer were compared to those from the trajectory log files (TLF).
Test results
A total of 52800 segments were delivered and measured. TLF analysis revealed the accuracy in LINAC’s VMAT segment boundary detection and MU delivery were within 0.3 degrees and 0.2 MU respectively.
The deviations were found to be highly reproducible, reflecting on stability of the LINAC & limitations in LINAC’s control system. The IQM accelerometer rotational accuracy was found to be within 0.4 degrees.
Conclusion
The variations in segment-wise beam delivery by the LINAC, and in monitoring by IQM, should be considered when performing calculation versus measurement analysis.
The calculation model performance was found to be satisfactory for Head & Neck VMAT beam monitoring.
This test report is based on a publication created by Princess Margaret Cancer Centre, Toronto (Canada).
Please click on the „Download“ button to download the complete publication.
Induced errors on clinical IMRT cases
Test purpose
Verify the detection capability of the IQM System for a variety of clinically relevant delivery errors.
Test method
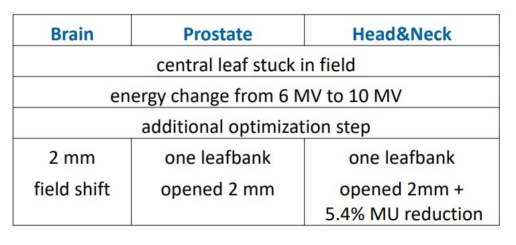
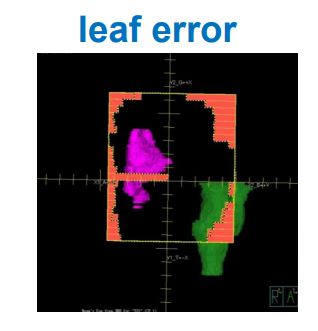
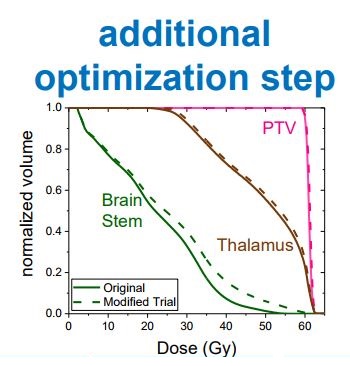
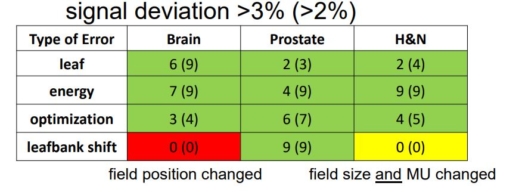
3 clinical IMRT plans were modified: Brain, Prostate, Head & Neck. All errors had a clinical effect: DVH parameters of either the targets or organs at risk changed by a few percentages.
Conclusion
IQM showed a very high error detection rate. Using a watch level of 2% and an action level of 3% IQM would have detected all but one of the induced errors.
This test report is based on a publication created by University Clinic, Würzburg (Germany).
Please click on the „Download“ button to download the complete publication.
